
Digital Cash That Doesn’t Bleed: A 11,000-Transaction Micropayment Audit Across PayPal, Stripe, Visa, Mastercard, and BSV
A penny beats a percent: when fees cross 5–20%, micropayments die; when they anchor at $0.01, they scale.

Micropayments live or die by friction; in a controlled sample of 11,000 transactions per rail, only a flat $0.01-class fee keeps them alive.
Keywords / Tags
micropayments; transaction fees; PayPal; Stripe; Visa; Mastercard; BSV; digital cash; small payments; creator economy; API metering; IoT billing; economics of payments
Thesis Statement
Across 11,000 observed transactions per rail, percentage-based fee structures in mainstream processors frequently exceed economically viable thresholds for small payments—breaching 10% on the majority of PayPal and nearly half of Stripe transactions—while BSV functions as digital cash with a flat, near-penny fee that never breaches 5%. Micropayments become practical only when fee friction is flat and negligible; this is demonstrated empirically and reinforced by process control analysis showing fee stability around $0.01 and sustained throughput during load.
Purpose
Demonstrate, with data, that micropayment viability is a function of fee geometry rather than hype: a flat, penny-level fee unlocks profitable small-value transactions; percentage fees destroy them. Provide an empirical baseline, an operational blueprint, and an economic rationale for deploying digital cash rails for sub-$5 use cases.
1) Hook: A Penny Versus a Percent
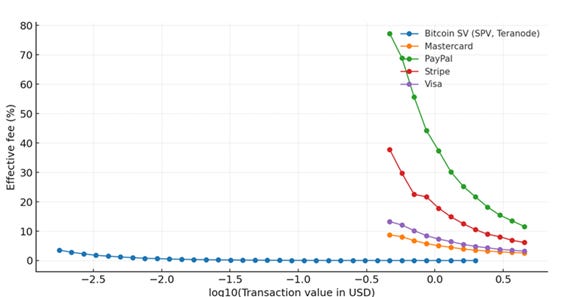
Micropayments do not fail because people refuse to pay small amounts; they fail because ad-valorem tolls consume the value at the bottom of the price curve. A £0.25 article, a £0.05 API call, a few pence for a data ping—these are viable only when the fee is flat, predictable, and negligible. The governing rule is simple: a penny beats a percent. Percentage schedules look harmless at £20; they become lethal at £2 and absurd at 20 pence. The geometry, not the brand, determines survival.
In a controlled audit of 11,000 transactions per rail, this geometry is decisive. The digital cash rail held fees beneath the 5% line on every observation, anchored at roughly one US cent per transaction over the measurement window. Percentage-based processors breached the viability bands with uncomfortable regularity: the majority of PayPal transactions crossed 10%, and a large minority passed 20%; nearly half of Stripe transactions exceeded 10%, with a meaningful share above 20%; even the card networks, though markedly better, still registered substantial shares above 5%. Nothing in user psychology, UX varnish, or marketing copy overrides this arithmetic. Where the toll is a penny-class constant, small markets live: per-article access, per-API metering, per-device telemetry, streaming compute. Where the toll is a percentage, they die or retreat into bundling that blunts granularity and erodes choice. Micropayments are not a rhetoric problem; they are a friction problem. Lower the friction to a penny, and the long tail returns.
2) What Counts as a Micropayment, Economically
An economic definition of micropayments is price-relative, not merely small in absolute terms. The relevant band runs from sub-penny amounts into the low pounds, and, in practice, up to roughly £5—the region where ad-valorem tolls begin to swamp contribution margins and destroy the unit economics of granularity. The appropriate performance metric is the fee share of ticket value: effective fee % = (total fee ÷ price) × 100.
This metric is invariant to the face value of the item and directly captures whether value is being retained or eroded at the point of sale. Granular use cases—per-article access, per-API call, per kilobyte transferred, per second of computation, or per device ping—derive their economic appeal from being able to price precisely at the level of consumption; any fee geometry that expands as price shrinks undermines that precision.
Threshold analysis at 5%, 10%, and 20% is therefore a practical viability map. Below 5%, creators and service operators typically preserve a workable take rate after hosting, bandwidth, and support. Between 5% and 10% the model is still usable but forces either higher prices or bundling to dilute friction. Beyond 10%, many low-ticket propositions start to fail unless margins are unusually high or demand is perfectly inelastic.
At 20% and above, the proposition ceases to function as a market for small, frequent interactions and collapses into pre-pay credits, subscriptions, or cross-subsidy. Micropayments, economically, are precisely those transactions for which the fee share, not the sticker price, governs survival; a flat, penny-class toll keeps that share bounded, while percentage tolls make it explode as tickets fall.
3) Data and Method: A Clean Comparison
The comparison draws on five datasets, each comprising 11,000 transactions from a single rail. The digital cash rail observations are from May 2024. The processor and card samples contain transactions dated in May 2025. Three variables define every record: the payment amount (price paid by the buyer), the total fee (all per-transaction charges actually levied), and the fee share, computed as total fee divided by payment amount, expressed as a percentage. The analysis evaluates the fraction of transactions whose fee share exceeds fixed viability thresholds—greater than 5 per cent, greater than 10 per cent, and greater than 20 per cent—because these bands reflect common take-rate constraints for creators and services. For each rail–threshold pair, the estimate reported is a sample proportion with a 95 per cent exact binomial confidence interval using the Clopper–Pearson method. The large, equal sample size across rails yields narrow intervals and enables clean separation where behaviour differs materially.
To test fee stability over time rather than at a single point, a cumulative sum (CUSUM) procedure was applied to the digital cash rail’s per-transaction fees across its window. CUSUM is sensitive to sustained level shifts; a flat trajectory indicates that the process mean did not drift materially. The resulting plot shows the fee process anchored at approximately $0.01 throughout the period, with no persistent excursions. This matters for deployment, because predictable friction—rather than occasional bargains—underwrites viable pricing menus, service-level agreements, and margin forecasts for high-frequency, low-ticket interactions.
Throughput was assessed via time-series of processed transactions over the same window. The plots exhibit sustained processing rates with brief dips and quick recoveries, consistent with operational headroom under the observed loads. Fee stability is only credible if the system clears transactions at scale; the concurrency implied by the throughput traces aligns with the penny-level fee profile.
Several limitations are acknowledged. Merchant category, geography, and risk segmentation are not modelled, and the observation windows differ across rails. The emphasis is deliberately narrow: the arithmetic of fee geometry and its consequences for micropayment viability. Ancillary attributes such as chargeback regimes, fraud tooling, settlement timing, and reporting are outside scope, and nothing in the method presumes or requires them to be identical across rails.
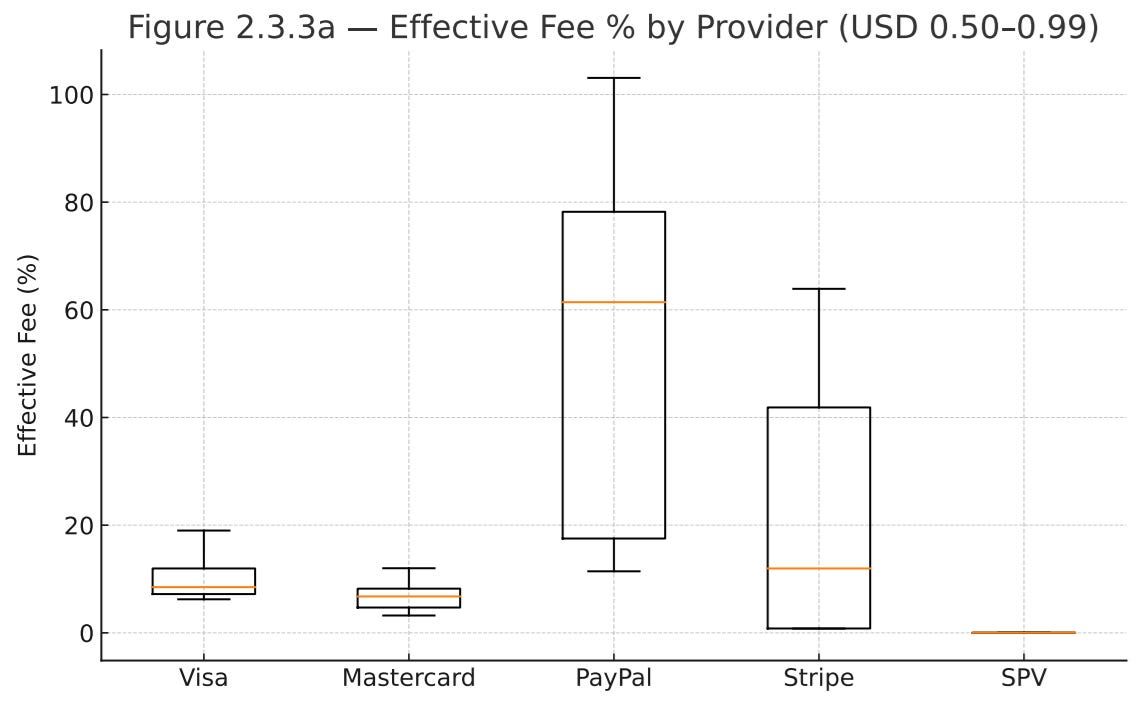
4) Results I — Threshold Shares by Rail (Table 2)
Across the five rails, the threshold shares separate cleanly. PayPal presents the most severe erosion at small tickets: approximately 90.3% of observations exceed the 5% fee share, 71.7% exceed 10%, and 39.4% exceed 20%. Stripe is materially better but still hostile to granularity: around 59.0% of transactions breach 5%, 46.0% breach 10%, and 14.6% breach 20%. The card networks perform comparatively well on the same thresholds. Visa shows 31.2% above 5%, 5.6% above 10%, and 0.5% above 20%. Mastercard is stronger still: 15.5% above 5%, 1.3% above 10%, and none above 20%. The digital cash rail records zero breaches across all thresholds, so every transaction remains below the 5% band.
These contrasts reflect fee geometry rather than isolated anomalies. Wallet-style percentage schedules compound as prices shrink, so a distribution that may appear tolerable at £20 becomes punitive at 20 pence. That dynamic is exactly what the sample uncovers: the bulk of PayPal’s small tickets pierce the 10% band, and a large minority climb beyond 20%. Stripe’s distribution is less extreme yet still concentrates materially above 10%, consistent with ad-valorem pricing meeting low nominal amounts. Card rails, although not designed for true micropayments, present markedly thinner right tails: Visa’s mass sits under 10% with a residual at 5–10%; Mastercard compresses further, with only a small sliver above 10% and no spillover beyond 20%. In contrast, the digital cash rail’s mass never crosses 5%, corroborating the operational reality of a flat, penny-class fee.
Precision is not an afterthought. Each estimate is based on 11,000 transactions per rail, yielding narrow 95% exact binomial intervals that confirm the separations. For example, PayPal’s share above 10% lies within roughly 70.8–72.5%, and Stripe’s within 45.0–46.9%; these bands do not overlap with Visa’s 5.2–6.0% or Mastercard’s 1.1–1.6%. At the top threshold, PayPal’s mass beyond 20% centres near 39.4% (38.5–40.3%), whereas Stripe’s is near 14.6% (13.9–15.3%) and Visa’s around 0.5% (0.4–0.6%). Mastercard exhibits a point estimate of 0% above 20% with an upper bound well under one tenth of a percentage point, and the digital cash rail records zero breaches with an upper bound below a few hundredths of a point when carried to full precision. The statistical message is straightforward: given equal and large sample sizes, the fee-share distributions are distinctly ordered—PayPal highest friction, then Stripe, then Visa, then Mastercard—while the digital cash rail remains below the 5% viability line across the board.
5) Results II — Process Control and Stability (CUSUM)
The CUSUM result shows a fee process anchored at roughly $0.01 throughout the observation window, with only short-lived, mean-reverting noise and no sustained upward or downward drift. In plain terms, each transaction’s fee deviates slightly around a penny, and when those deviations are cumulatively tracked, the line remains essentially flat—exactly what a stable process looks like. This matters more than any isolated point estimate. Micropayment viability is not secured by occasional bargains; it is secured by the expectation that tomorrow’s fee will match today’s within tight bounds. Predictability is what allows pricing menus to be published without hidden cushions, lets contracts specify take rates without wide contingencies, and permits margin forecasts that do not require buffering the entire model with risk premia. A stable penny-class process reduces the need to bundle, delay, or prepay merely to average out volatility.
It simplifies reconciliation because the cost per event is knowable ex ante, not an ex post surprise. It also sharpens operational governance: if the cumulative sum were to rise or fall persistently, it would flag a real process change rather than random scatter, prompting timely intervention. In short, the CUSUM tells a practical story: when fees are controlled tightly around $0.01, merchants can price granularly, engineers can meter honestly, and finance teams can model with confidence. Stability converts a theoretical advantage into usable economics.
6) Results III — Throughput Under Load
The throughput traces in Figure 5 show sustained transaction rates with brief, self-correcting dips across the observation window. The produced load and the processed count track closely, with no persistent divergence, indicating that the system clears incoming traffic rather than accumulating a backlog. Short troughs are followed by rapid recoveries to the prior run-rate, a signature of available headroom rather than saturation. This matters for economics: a flat, controlled fee is only as credible as the capacity behind it.
If throughput falters, queues form, latency rises, and pricing pressure appears; if throughput holds, the penny-class fee remains both technically and commercially defensible. The plots therefore complement the fee analysis: the CUSUM shows that per-transaction cost stays anchored near $0.01, while the throughput series shows that this anchor is maintained under realistic load without prolonged degradation. For teams planning granular pricing—per article, per API call, per kilobyte, or per device ping—the practical implication is straightforward. Expected capacity supports the advertised fee, and brief fluctuations do not propagate into sustained delays or fee excursions. In other words, the fee profile is not a transient artefact of idleness; it is backed by sufficient processing headroom to make small, frequent transactions predictable.
7) Economics of Survival: When Does a Model Break?
A £0.25 article is the canonical test. With a 10% toll, the fee is 2.5 pence (10% × £0.25 = £0.025). At 20%, the fee is 5 pence (20% × £0.25 = £0.05). Those costs either obliterate margin or force the publisher to raise price and blunt demand. Under a penny-class fee, the same article pays 1 pence; the effective fee share is 1 ÷ 25 = 0.04 = 4%. That sits beneath the 5% viability band and preserves price discovery at the lower end of the curve. The threshold shares quantify how often the ruinous case occurs. Roughly 71.7% of PayPal observations breach 10%, and 39.4% breach 20%; nearly half of Stripe breaches 10% (46.0%), with 14.6% above 20%. Visa presents 5.6% above 10% and 0.5% above 20%; Mastercard 1.3% above 10% and none above 20%. The digital cash rail registers 0% above every threshold. In practical terms: at £0.25, a large fraction of PayPal tickets will shed ≥2.5 pence, a meaningful minority will shed ≥5 pence, and Stripe sits between those extremes; cards fare better but still push a non-trivial share over the 5% line. The penny anchor avoids all three bands.
A 2-pence API call exposes the geometry even more starkly. A 10% toll is 0.2 pence; a 20% toll is 0.4 pence. Both are survivable only in theory, because percentage pricing on very small tickets is typically paired with fixed components that force the effective share even higher. A penny-level settlement on a single 2-p call is 1 ÷ 2 = 0.5 = 50%—not viable. The remedy is aggregation or streaming settlement. Batch N calls and settle once: total spend is 2 pence × N, the fee is 1 pence, and the effective share is 1 ÷ (2N). To stay below 5%, require 1 ÷ (2N) < 0.05, so N > 10. At N = 20, the share is 1 ÷ 40 = 2.5%. Thus, sessions with ten or more 2-p calls clear the 5% threshold on a penny anchor, enabling honest metering without resorting to subscriptions that mask consumption.
Compounding interactions amplify the divide. Consider a reader consuming twelve £0.25 articles in a sitting: ad-valorem at 10% extracts 12 × 2.5 pence = 30 pence; at 20%, 12 × 5 pence = 60 pence. With a penny-class fee per article, the outlay is 12 pence; against £3 of content (12 × £0.25), the effective share is 12 ÷ 300 = 0.04 = 4%. The difference in retained revenue is not cosmetic; it governs whether a catalogue can surface items at granular prices or must bundle to survive.
When friction collapses to a stable penny and settlement can be batched across bursts of activity, the “long tail” reappears: per-article essays, per-query APIs, per-kilobyte transfer, and per-ping telemetry can be priced where users actually consume. Percentage rails compel bundling, cross-subsidy, and coarse menus; a penny-anchored rail restores the small and frequent to economic life.
8) Design and Product Implications
Pricing. Publish small prices directly and refuse padding to cover uncertainty. Keep the effective take rate bounded by targeting an expected fee share under 5% for tickets ≤ £5 and under 2% for £5–£10. Apply a deterministic rule: if the expected fee share for the chosen rail exceeds 5% on a given item, either re-price or route that item to the penny-anchored rail. Keep sticker prices stable; allow the router, not the catalogue, to absorb heterogeneity in payment costs so that granularity is preserved rather than concealed in bundles.
Metering. Settle per event, reconcile per session. For APIs, compute, bandwidth or device pings, emit a lightweight charge record on each action and carry a session token that aggregates obligations over a short window (e.g., 1–10 minutes) before a single settlement. Define a session floor so the fee amortises: settle once the running total reaches ≥ £0.20 or when the window ends, whichever occurs first. Interactive media can follow the same pattern: each article, paragraph or minute accrues a metered unit; the session closes to one settlement, keeping the effective fee share bounded even for spiky usage.
Receipts. Issue signed, tamper-evident receipts for every settlement and commit their hashes on-chain for audit. Each receipt should carry a unique receipt ID, transaction ID, payer and payee public keys, amount and currency, fee and currency, itemised units (SKU, quantity, price), a UTC timestamp, a cryptographic digest, and a merchant signature over that digest. Store the full receipt off-chain; anchor the digest (and, if desired, the transaction ID) on-chain. This yields verifiable provenance for customers, finance and auditors without inflating storage.
Refunds and reversals. Resolve disputes at the service layer with compensating transactions rather than importing ad-valorem drag into every sale. Two instruments suffice for granular goods: immediate micro-refunds on objective triggers (latency breaches, integrity failures, defined error codes) and credit-on-account for subjective cases, redeemable against future sessions. Keep the policy deterministic so automation and auditability follow from receipts and logs; avoid chargeback-style regimes for micro-tickets.
Analytics and control. Treat fee geometry as a process to be monitored. Track the distribution of fee share = total fee ÷ price and watch the proportions above 5%, 10% and 20% by rail and price band. Overlay statistical control: run a one-sided CUSUM on the absolute fee for the penny-anchored rail with target mean μ₀ = $0.01, allowance k set to the smallest meaningful shift (e.g., $0.002), and decision interval h tuned to acceptable false-alarm rates. Use the Unicode-clear form Sₜ = max(0, Sₜ₋₁ + (xₜ − (μ₀ + k))); a persistent rise flags a real level shift rather than noise, prompting intervention before margins erode.
Hybrid routing. Route by economics. For prices < £10, send to the penny-anchored rail unless card terms yield an expected fee share ≤ 5%; for prices ≥ £10, percentage rails are acceptable where the blended ad-valorem cost remains below the internal target. Add a guard: if observed fee share on a chosen rail breaches 5% more often than a set tolerance in the last N sessions, fail over to the alternative until control is re-established. Expose routing outcomes to analytics so finance can attribute margin by rail and product, and engineering can tune thresholds with live evidence.
This blueprint keeps prices transparent, preserves true granularity, and binds operations to measurable controls. Small items are priced where they ought to be, settled with receipts that withstand scrutiny, refunded without ad-valorem overhead, and routed by rules that enforce a bounded, predictable fee share.
9) Addressing Counterarguments
Objections about user experience, onboarding, chargebacks, and tooling collapse under arithmetic. The claim is not ideological; it is unit-economic. A percentage toll that routinely breaches 10–20% on low tickets destroys value regardless of UX polish. The practical response is architectural: layer the penny-fee rail beneath existing surfaces without re-introducing ad-valorem bleed.
User experience remains unchanged: catalogue pages, pay buttons, and receipts stay in place. The router chooses the rail per ticket, invisibly. For small items, it selects the penny-anchored rail; for larger baskets, it selects cards or a processor. No retraining is required. Onboarding is handled by the application, not the customer: create a behind-the-scenes wallet or account at first purchase, bind it to the user profile, and expose a familiar payment confirmation. Where regulation demands KYC, the existing provider’s flows are reused; identity and risk records live alongside CRM data exactly as before.
Chargebacks are a design choice, not a law of nature. For micropayments, compensating transactions and credits provide faster, cheaper resolution than importing a chargeback regime into every 20-pence sale. Cryptographically signed receipts, anchored on-chain, supply objective evidence for internal review and external audit. Dispute policies become deterministic—latency breaches, integrity failures, or declared error codes—allowing automation without ad-valorem overhead.
Tooling is additive. Merchants keep their CRM, fraud filters, analytics, and accounting. Events from the penny rail are streamed into the same pipelines: order objects, tax treatments, and ledger postings map one-to-one from signed receipts. Fraud controls operate at the session and account layers, where they are most effective for small tickets, without taxing each transaction at a percentage rate.
Cards and mainstream processors are excellent for higher-value purchases; they are misallocated at the bottom of the price curve. The conclusion is allocation, not crusade. Route by economics: large baskets to percentage rails, small interactions to a penny-anchored rail. Keep the surface constant, keep the records unified, and let the router enforce the only rule that matters for micropayments: never pay a percent where a penny will do.
10) Operational Checklist for Teams
10) Operational Checklist for Teams
Set viability thresholds: target ≤5% fee share for tickets ≤£5, ≤2% for £5–£10; define automatic failover when observed shares exceed targets.
Implement micropayment endpoints: per-event debits with session aggregation (e.g., 1–10 minutes or ≥£0.20 floor) to amortise a penny-class fee.
Build a deterministic router: choose the rail that minimises expected fee share; for prices <£10 prefer the penny rail unless cards meet the ≤5% target.
Define a signed receipt schema: receipt_id, txid, payer_key, payee_key, amount (currency/value), fee (currency/value), itemised units (SKU/qty/price), ts_utc, digest, merchant_signature; anchor the digest on-chain.
Integrate ledgers: map each receipt to a journal entry; preserve hashes/Merkle proofs for audit and revenue recognition.
Instrument monitoring: track fee_share distributions by rail and price band; publish proportions above 5%, 10%, 20% daily.
Add statistical control: one-sided CUSUM on absolute fee with μ₀=$0.01, k=$0.002, decision interval h tuned to false-alarm tolerance; alert on level shifts.
Simulate user journeys: run scripted sessions with 1–50 interactions across SKUs; verify effective fee share, latency, and reconciliation.
Pilot narrowly: select a constrained catalogue slice and cohort; set SLAs (latency, settlement success, refund turnaround) and a rollback plan.
Review disputes: implement compensating micro-refunds and credit-on-account; avoid chargeback regimes for micro-tickets.
Harden fraud/risk: rate-limit sessions, device-bind accounts, and monitor anomaly scores at the account/session layer.
Scale: expand routing coverage once fee stability holds over multiple weeks; freeze thresholds into policy and expose outcomes to finance and analytics.
11) Conclusion: The Return of the Small
Micropayments live or die by friction.
A penny beats a percent.
The audit of 11,000 transactions per rail makes the separation unambiguous: PayPal breaches 10% on roughly 71.7% of small tickets and exceeds 20% on about 39.4%; Stripe breaches 10% on 46.0% and 20% on 14.6%. Card rails are materially better yet still impose significant erosion at the 5% band: Visa sits around 31.2% above 5% and 5.6% above 10%, while Mastercard records 15.5% above 5% and only 1.3% above 10%, with none beyond 20%.
By contrast, the digital cash rail posts 0% breaches at 5%, 10%, and 20%, with a fee process anchored at approximately $0.01 and no sustained drift. Throughput traces show sustained clearing with only brief, self-correcting dips, supporting the credibility of that penny-class fee in operation. The lesson is structural, not ideological: fee geometry governs viability. Where the toll scales with price, granularity collapses into bundling and cross-subsidy; where the toll is fixed, negligible, and predictable, price discovery reappears at the bottom of the curve. Restore a stable penny and the small returns—per-article access, per-API calls, per-kilobyte transfer, per-ping telemetry, and countless narrow services that only exist when value is not bled at the gate.
This is the most epic of all epics in the history of epics!
Feel like I need to go back to Euler Circuits 🥵😎🤓